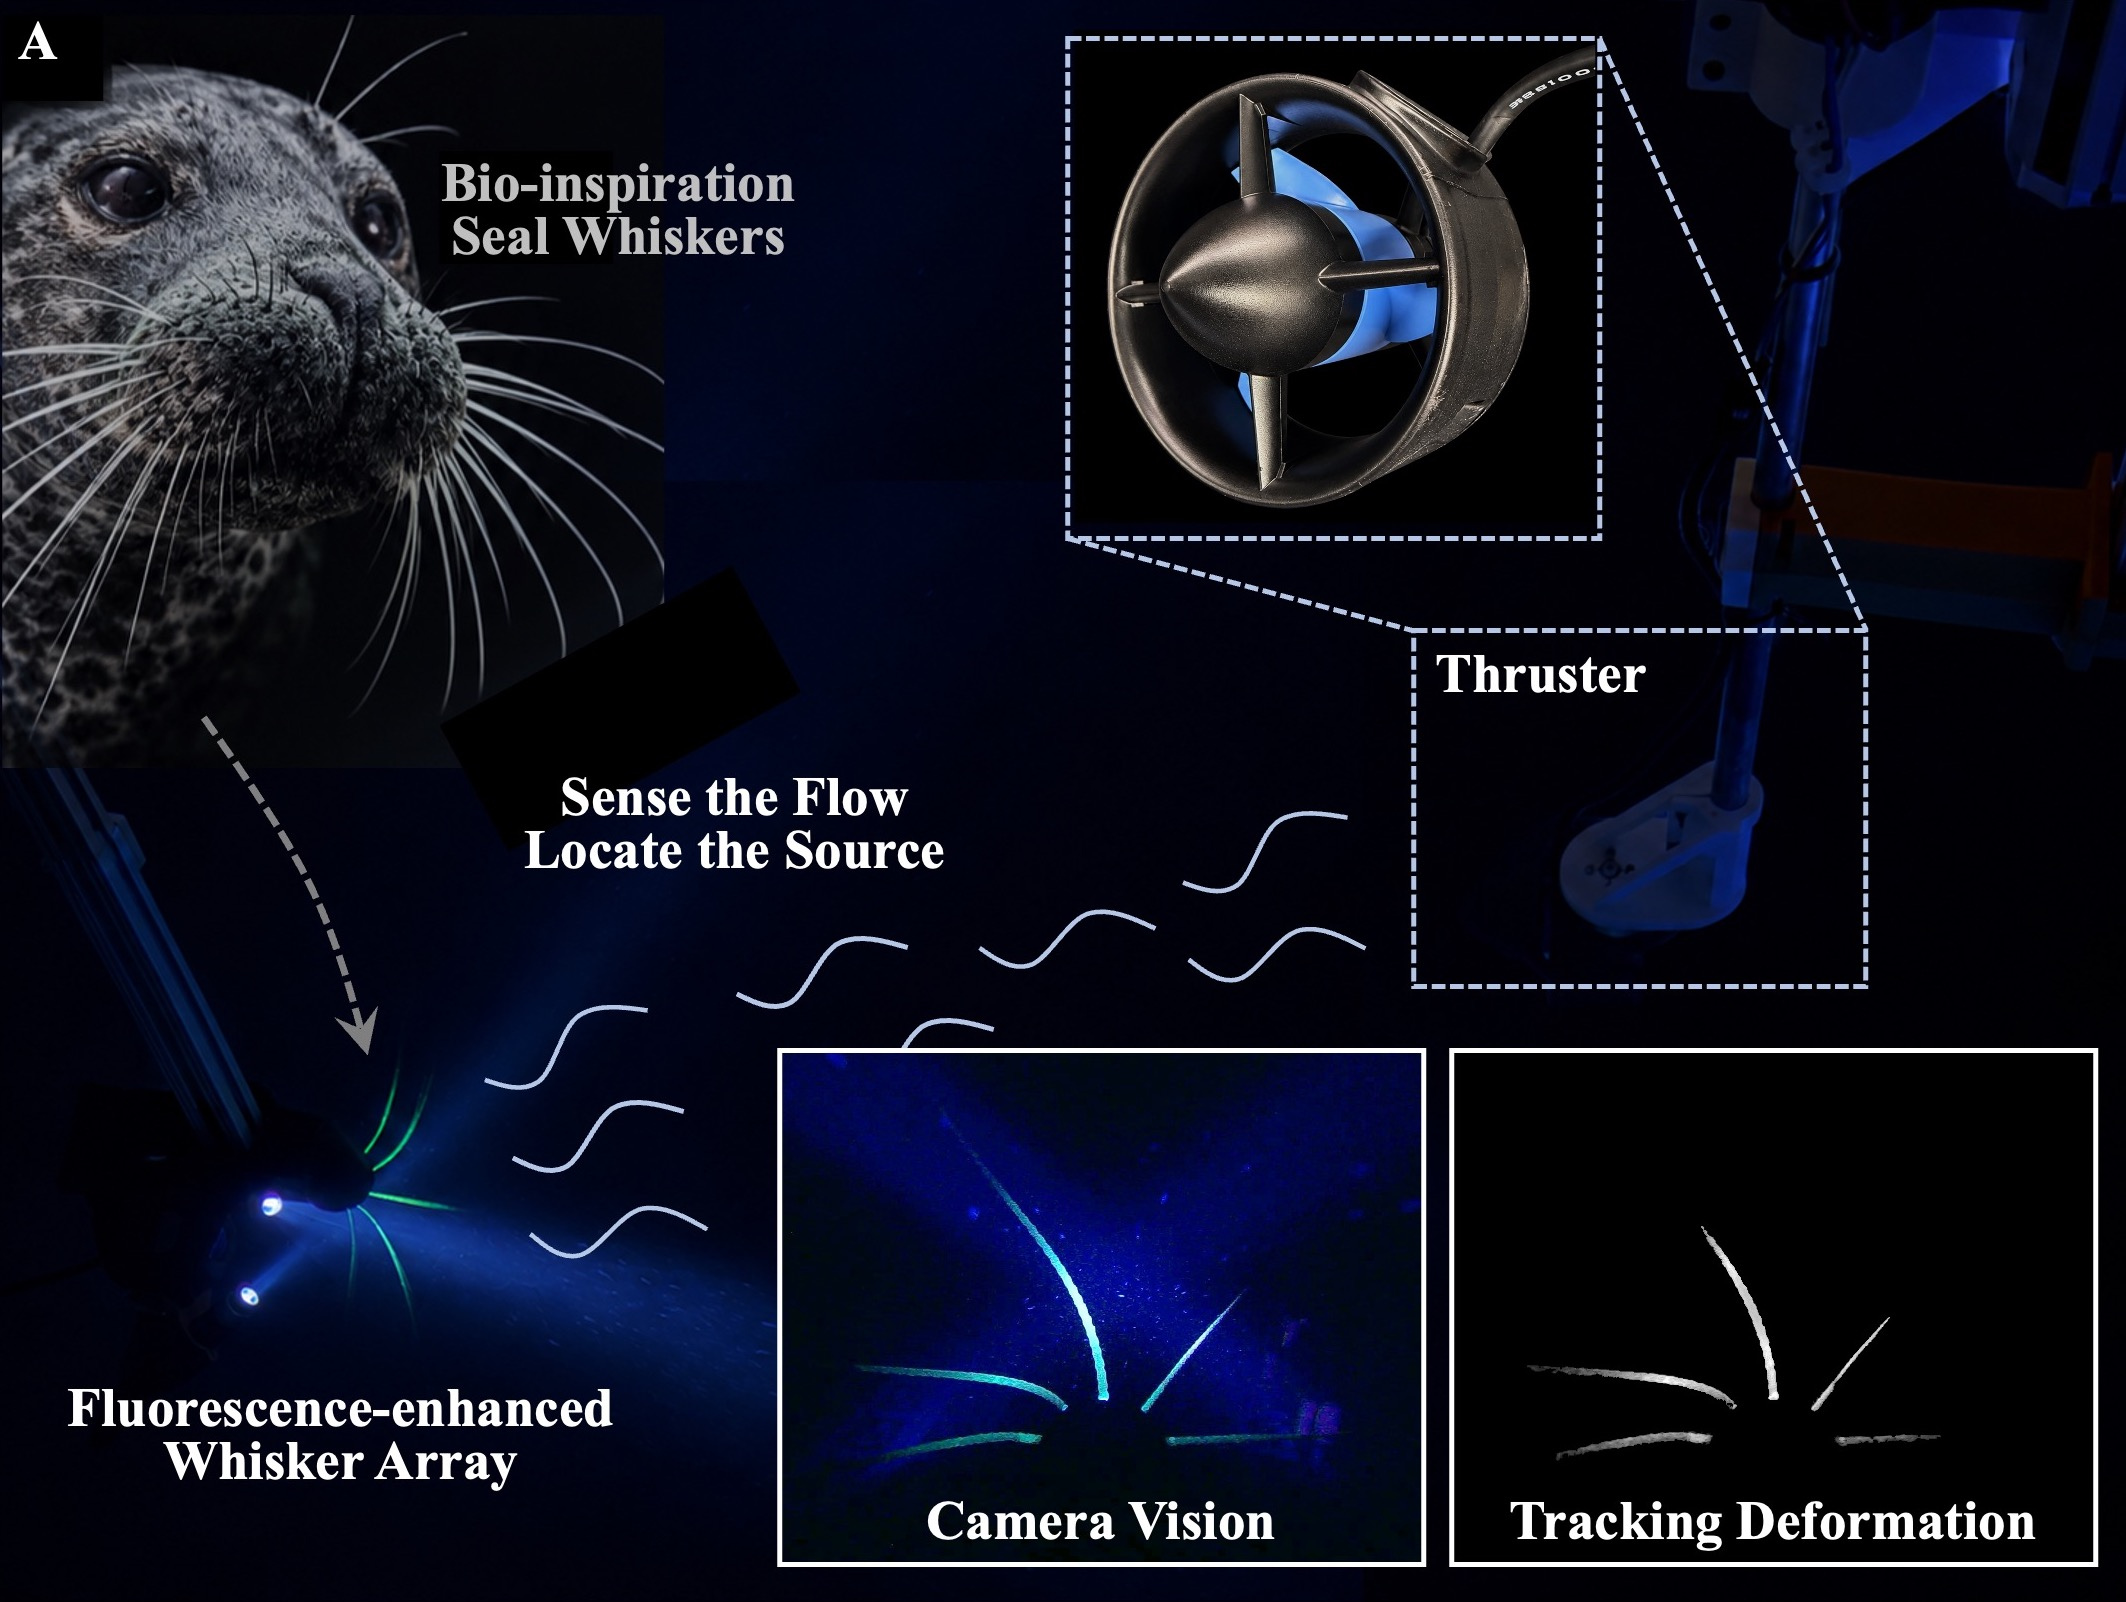
Five fluorescent whiskers and one camera estimate where an underwater thruster is, using the flow it creates.
A model trained on stationary sources follows a moving thruster.
The pool view, tracked whiskers, and predicted source position are
shown together. Playback: 20×.
Question
How can we observe marine life in the deep sea while minimizing our influence on it?
In dark water, observation often requires us to add light or sound.Those signals can change animal behavior and the observations we make.
Solution
Flow sensing with local optical readout
The source creates the flow. Fluorescence makes the sensor's response visible to a camera.
01 / Flow sensing
Locate the source through its hydrodynamic signal
Harbor seals use their whiskers to follow hydrodynamic trails. Inspired by this ability, our array senses the flow-induced bending of five whiskers. A camera observes the array, and a model estimates the source position from their deformation.
Flow from a source bends the whiskers. Their deformation carries information about where the source is.
02 / Local optical readout
Make the whiskers visible with fluorescence
Fluorescent pigment gives the whiskers strong contrast against the dark water. The camera reads their motion with illumination concentrated around the array.
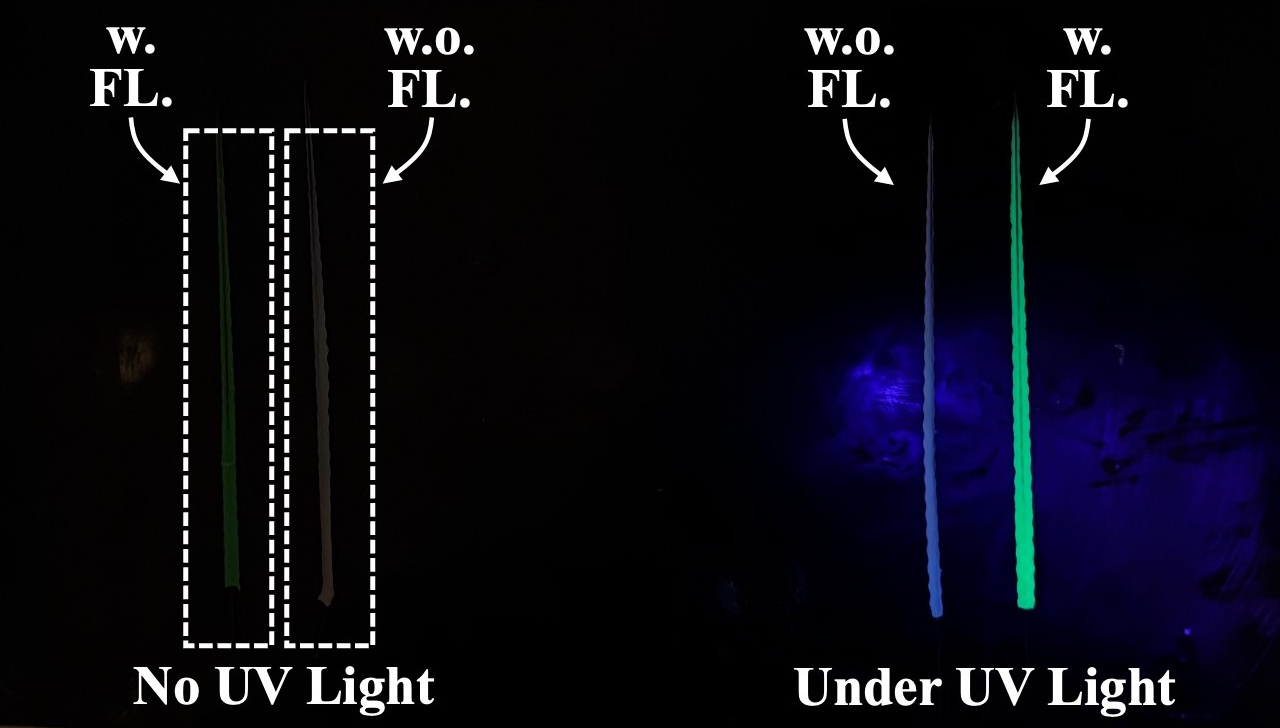
The whiskers become visible under low-power UV excitation (approximately 100 mW).
With UV excitation, the fluorescent whisker is clearly visible. The non-fluorescent whisker remains faint.
Whisker fabrication Materials and the two-stage molding process
Each whisker contains a 0.4 mm superelastic nitinol core inside a urethane shell with 5 wt% green fluorescent pigment. Two-stage molding forms the undulating, tapered profile.
Two-stage molding adds the fluorescent urethane shell around the nitinol core.
System
Measuring deformation with a single camera
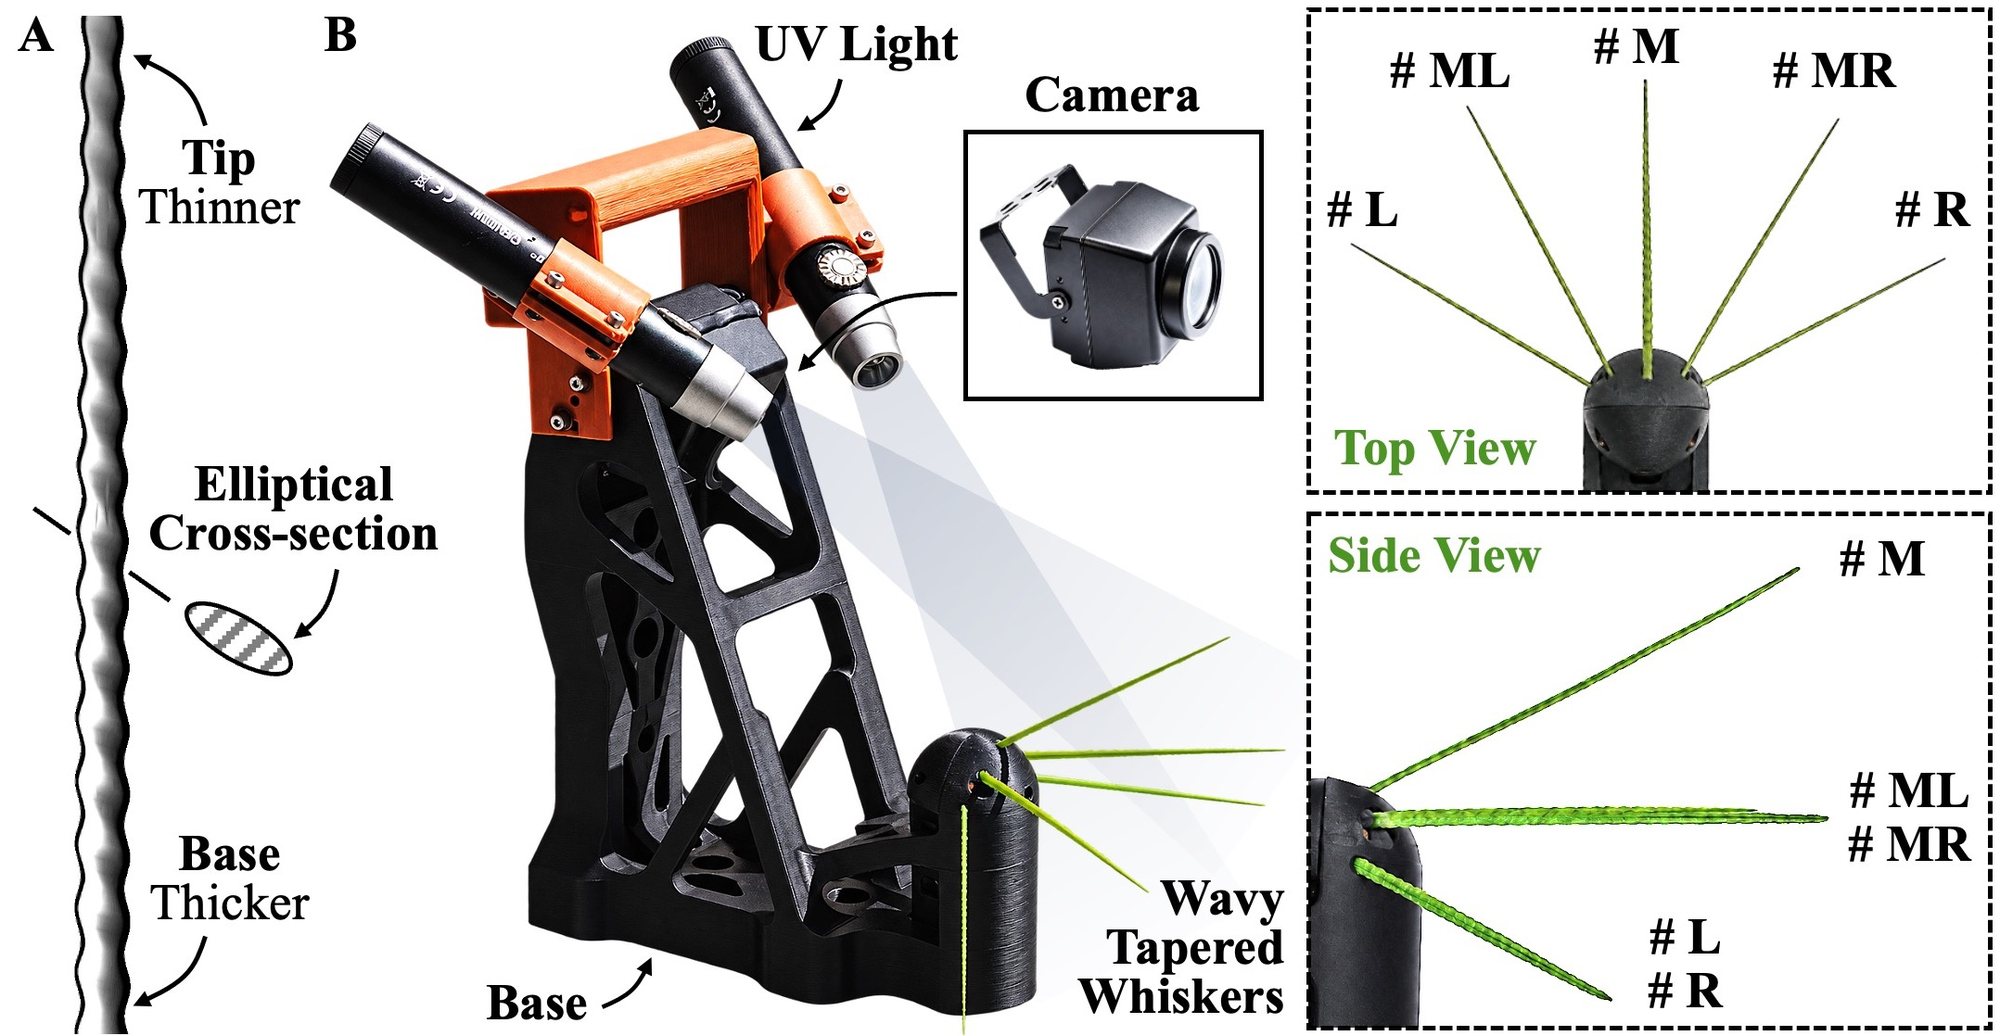
The sensing platform combines the whisker array, local UV excitation, and a visual tracking pipeline.
One camera, five whisker orientations
The platform is a 1080p, 60 Hz camera, two 365 nm UV
lights on either side of it, and five whiskers mounted at different
pitch and yaw angles. A single view cannot recover the full 3D
bending of one whisker, but because the whiskers point in different
directions, a deformation that is hard to see on one is pronounced
on another.
Whisker geometry and the compact sensing platform. Top and side
views show the different yaw and pitch angles of the five
whiskers.
Computer vision pipeline
Whisker motion becomes a source position
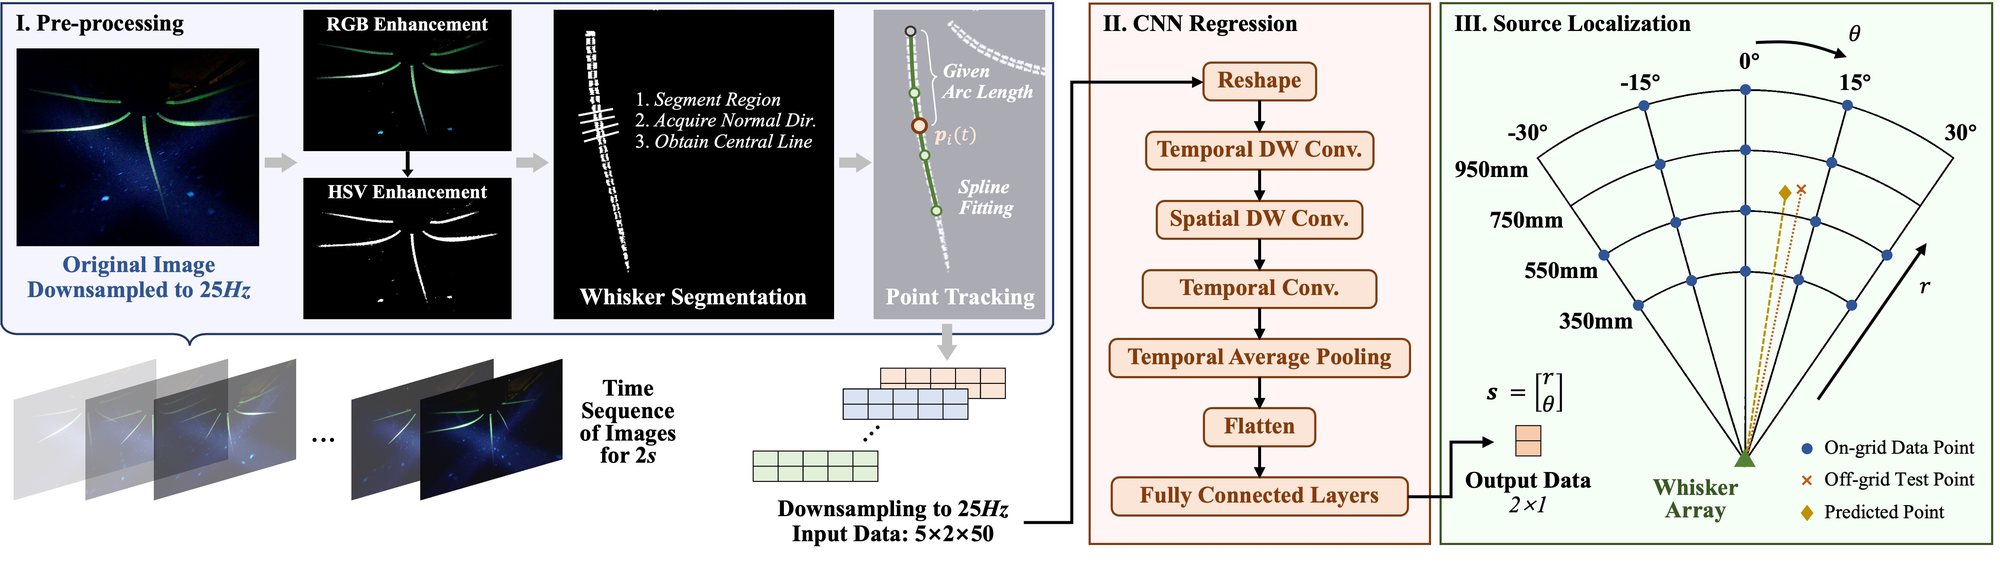
Spline centerlines and tracked points turn fluorescence into a
compact motion signal.
Each frame is enhanced to isolate the green fluorescence, the five
whiskers are segmented, and a point at a fixed arc length along each
spline centerline is tracked. Two seconds of these displacements (5
whiskers × 2 axes × 50 samples) go into a lightweight CNN that
outputs the source position (r, θ).
Pre-processing and tracking (left), CNN regression (middle), and
the polar localization frame (right).
Performance
Localization beyond the training positions
Stationary sources
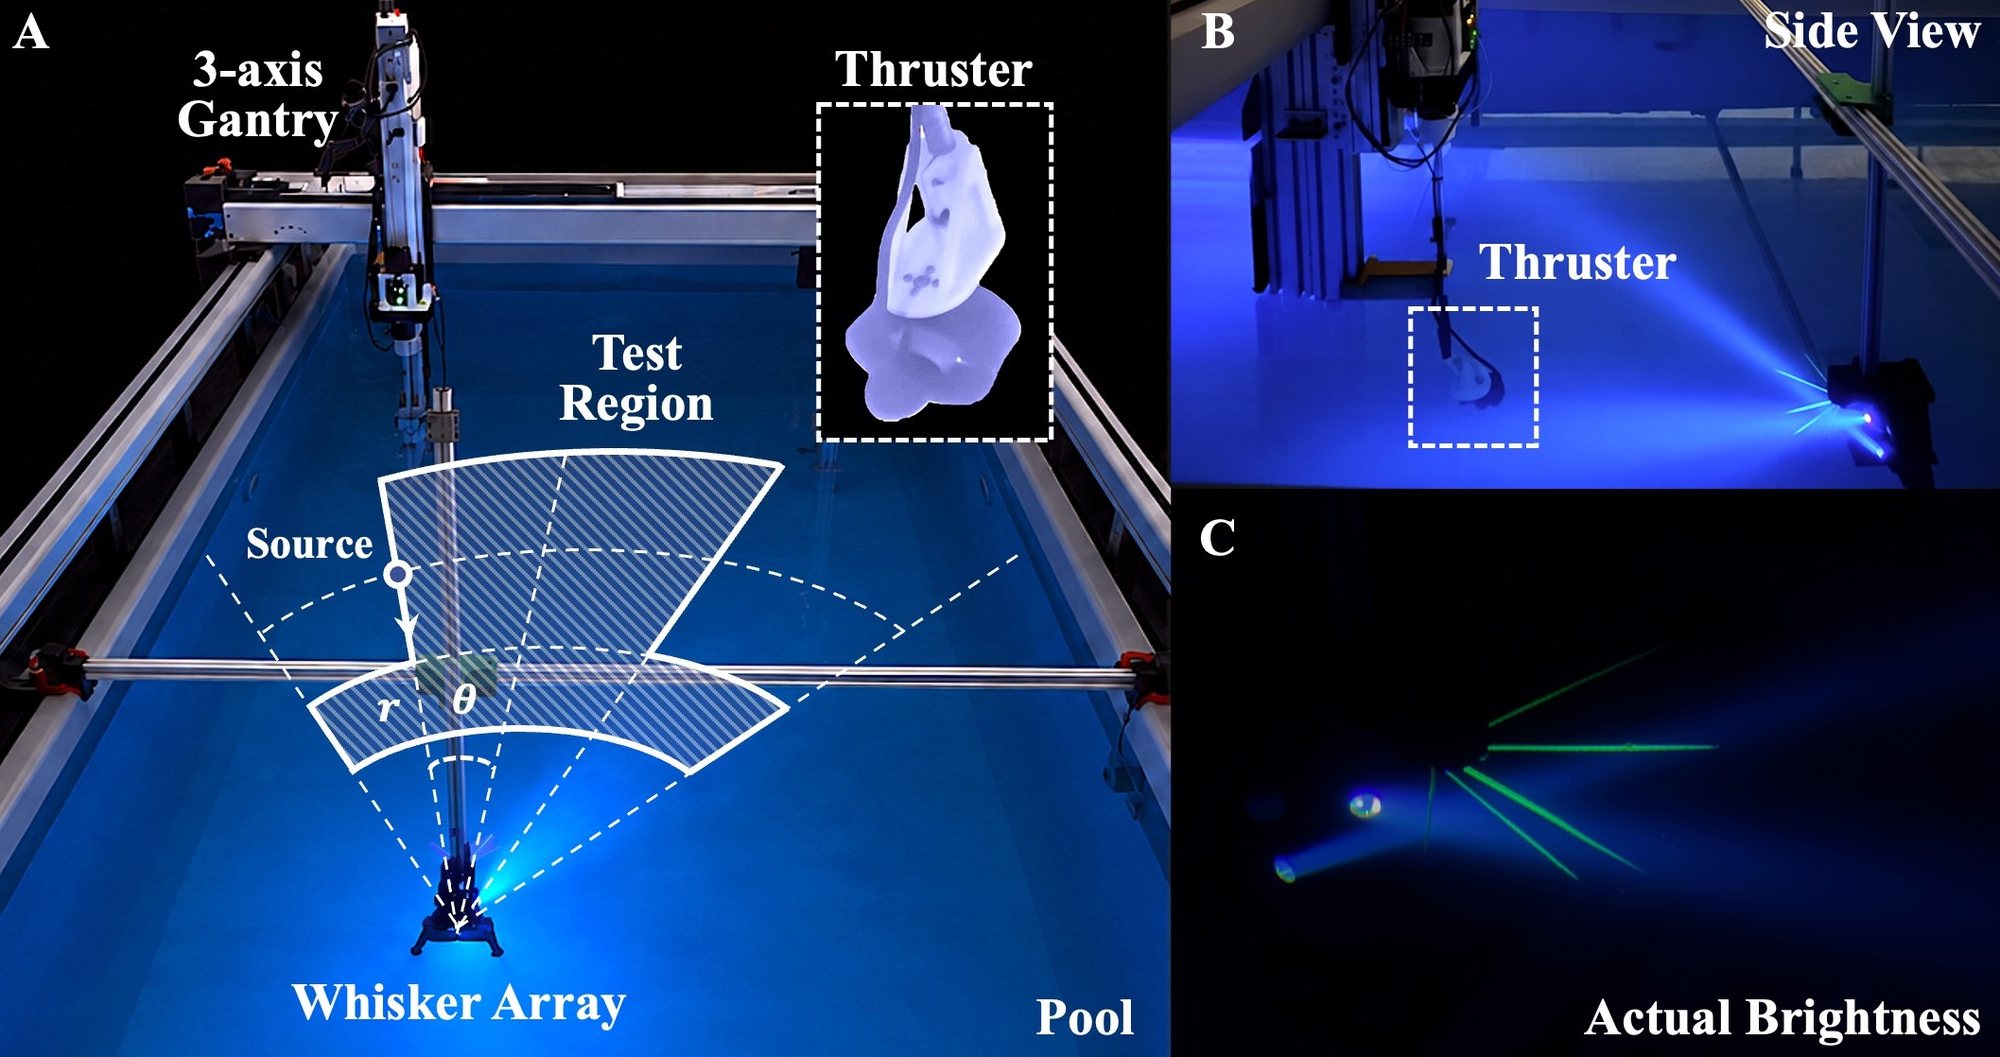
A thruster on a three-axis gantry is moved over a fan-shaped region
350–950 mm from the array and ±30° around its axis, always
facing the array at the same power. Training uses 16 grid positions
(8,640 two-second samples over two days); the test set adds 108
off-grid positions the model has never seen.
The pool setup. Panels A and B are brightened for visibility;
panel C shows the actual illumination during data collection.
88.1 mmMean spatial error
73.5 mmMean range error
2.48°Mean bearing error
Across 16 on-grid and 108 off-grid test positions.
Test points
Δr MAE (mm)
Δθ MAE (°)
Distance MAE (mm)
16 on-grid
45.2
0.47
47.2
108 off-grid
77.7
2.78
94.2
All
73.5
2.48
88.1
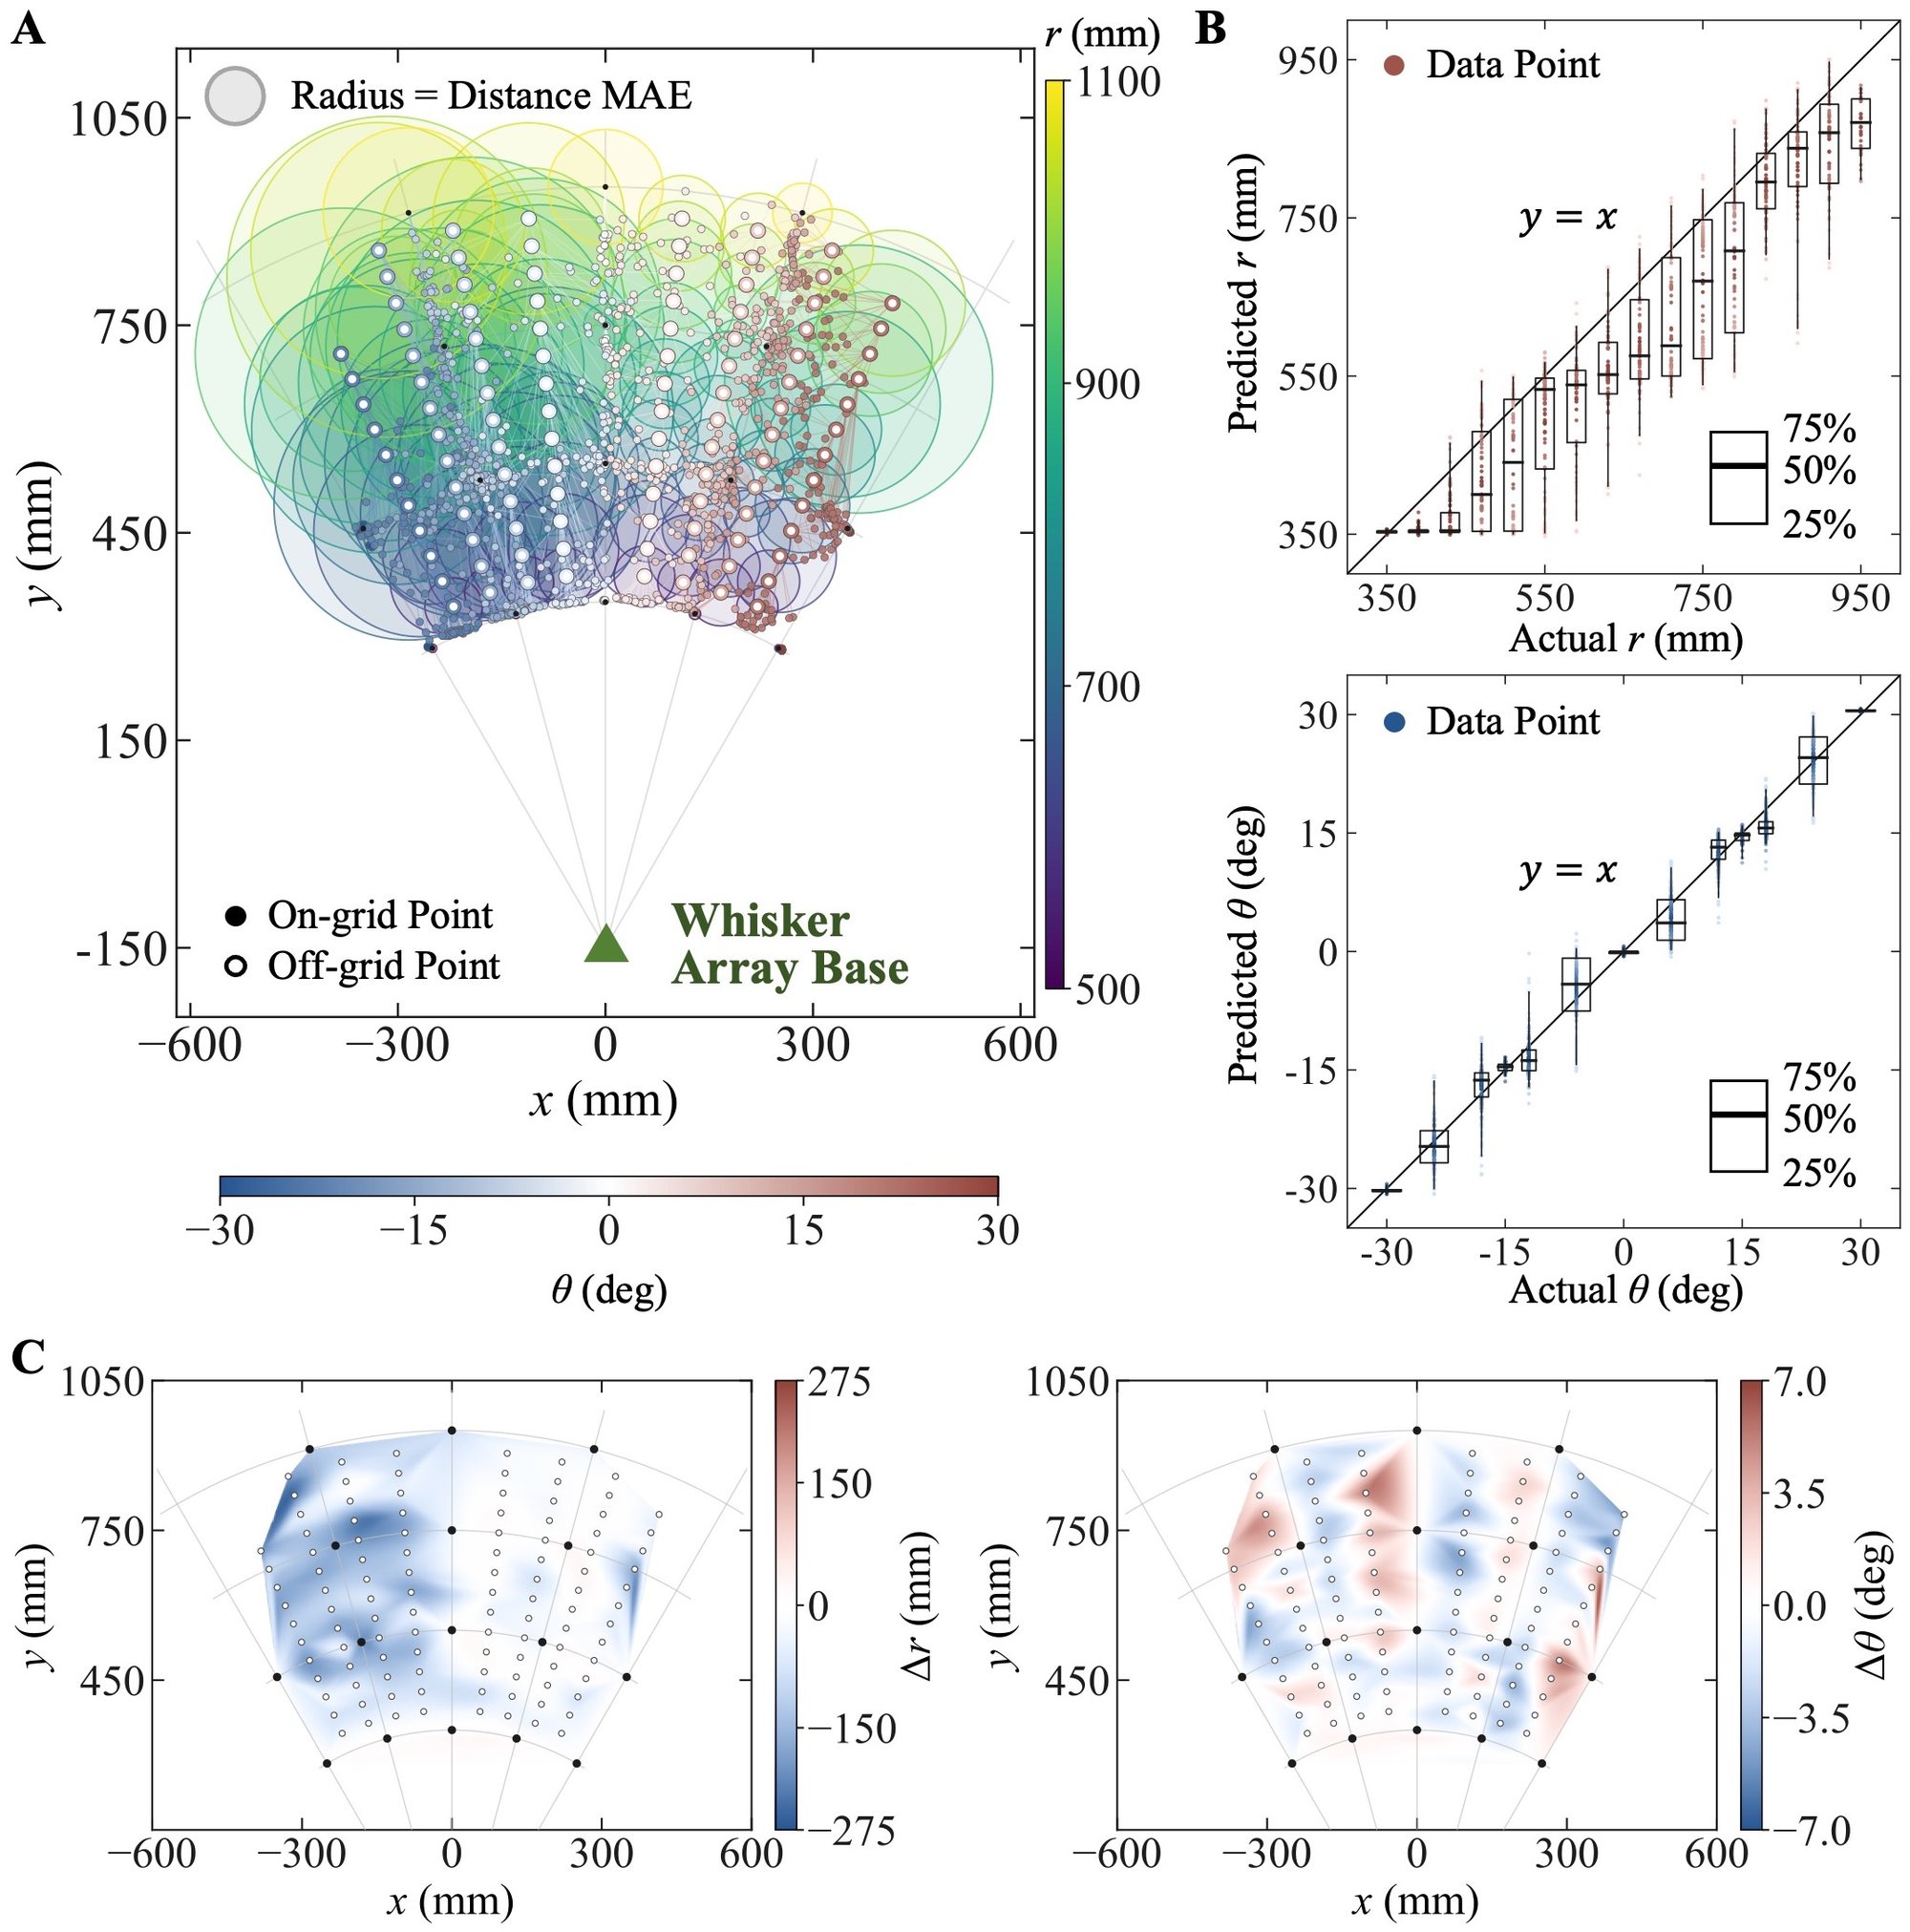
Bearing is learned better than range: angular estimates are generally more concentrated than range estimates, while off-grid range estimates are pulled toward the
nearest training radius. The mapping still interpolates, with
off-grid predictions clustering around their true locations.
Explore the localization results
Predictions, error distributions, and spatial maps
Predicted positions with per-location mean error (A), predicted
versus actual r and θ (B), and the spatial distribution of
radial and angular error (C).
Moving sources
Does the estimate follow different paths?
Arc-motion trials at three radii, with predicted positions in blue
and reference positions shown as open circles. Playback: 20×.
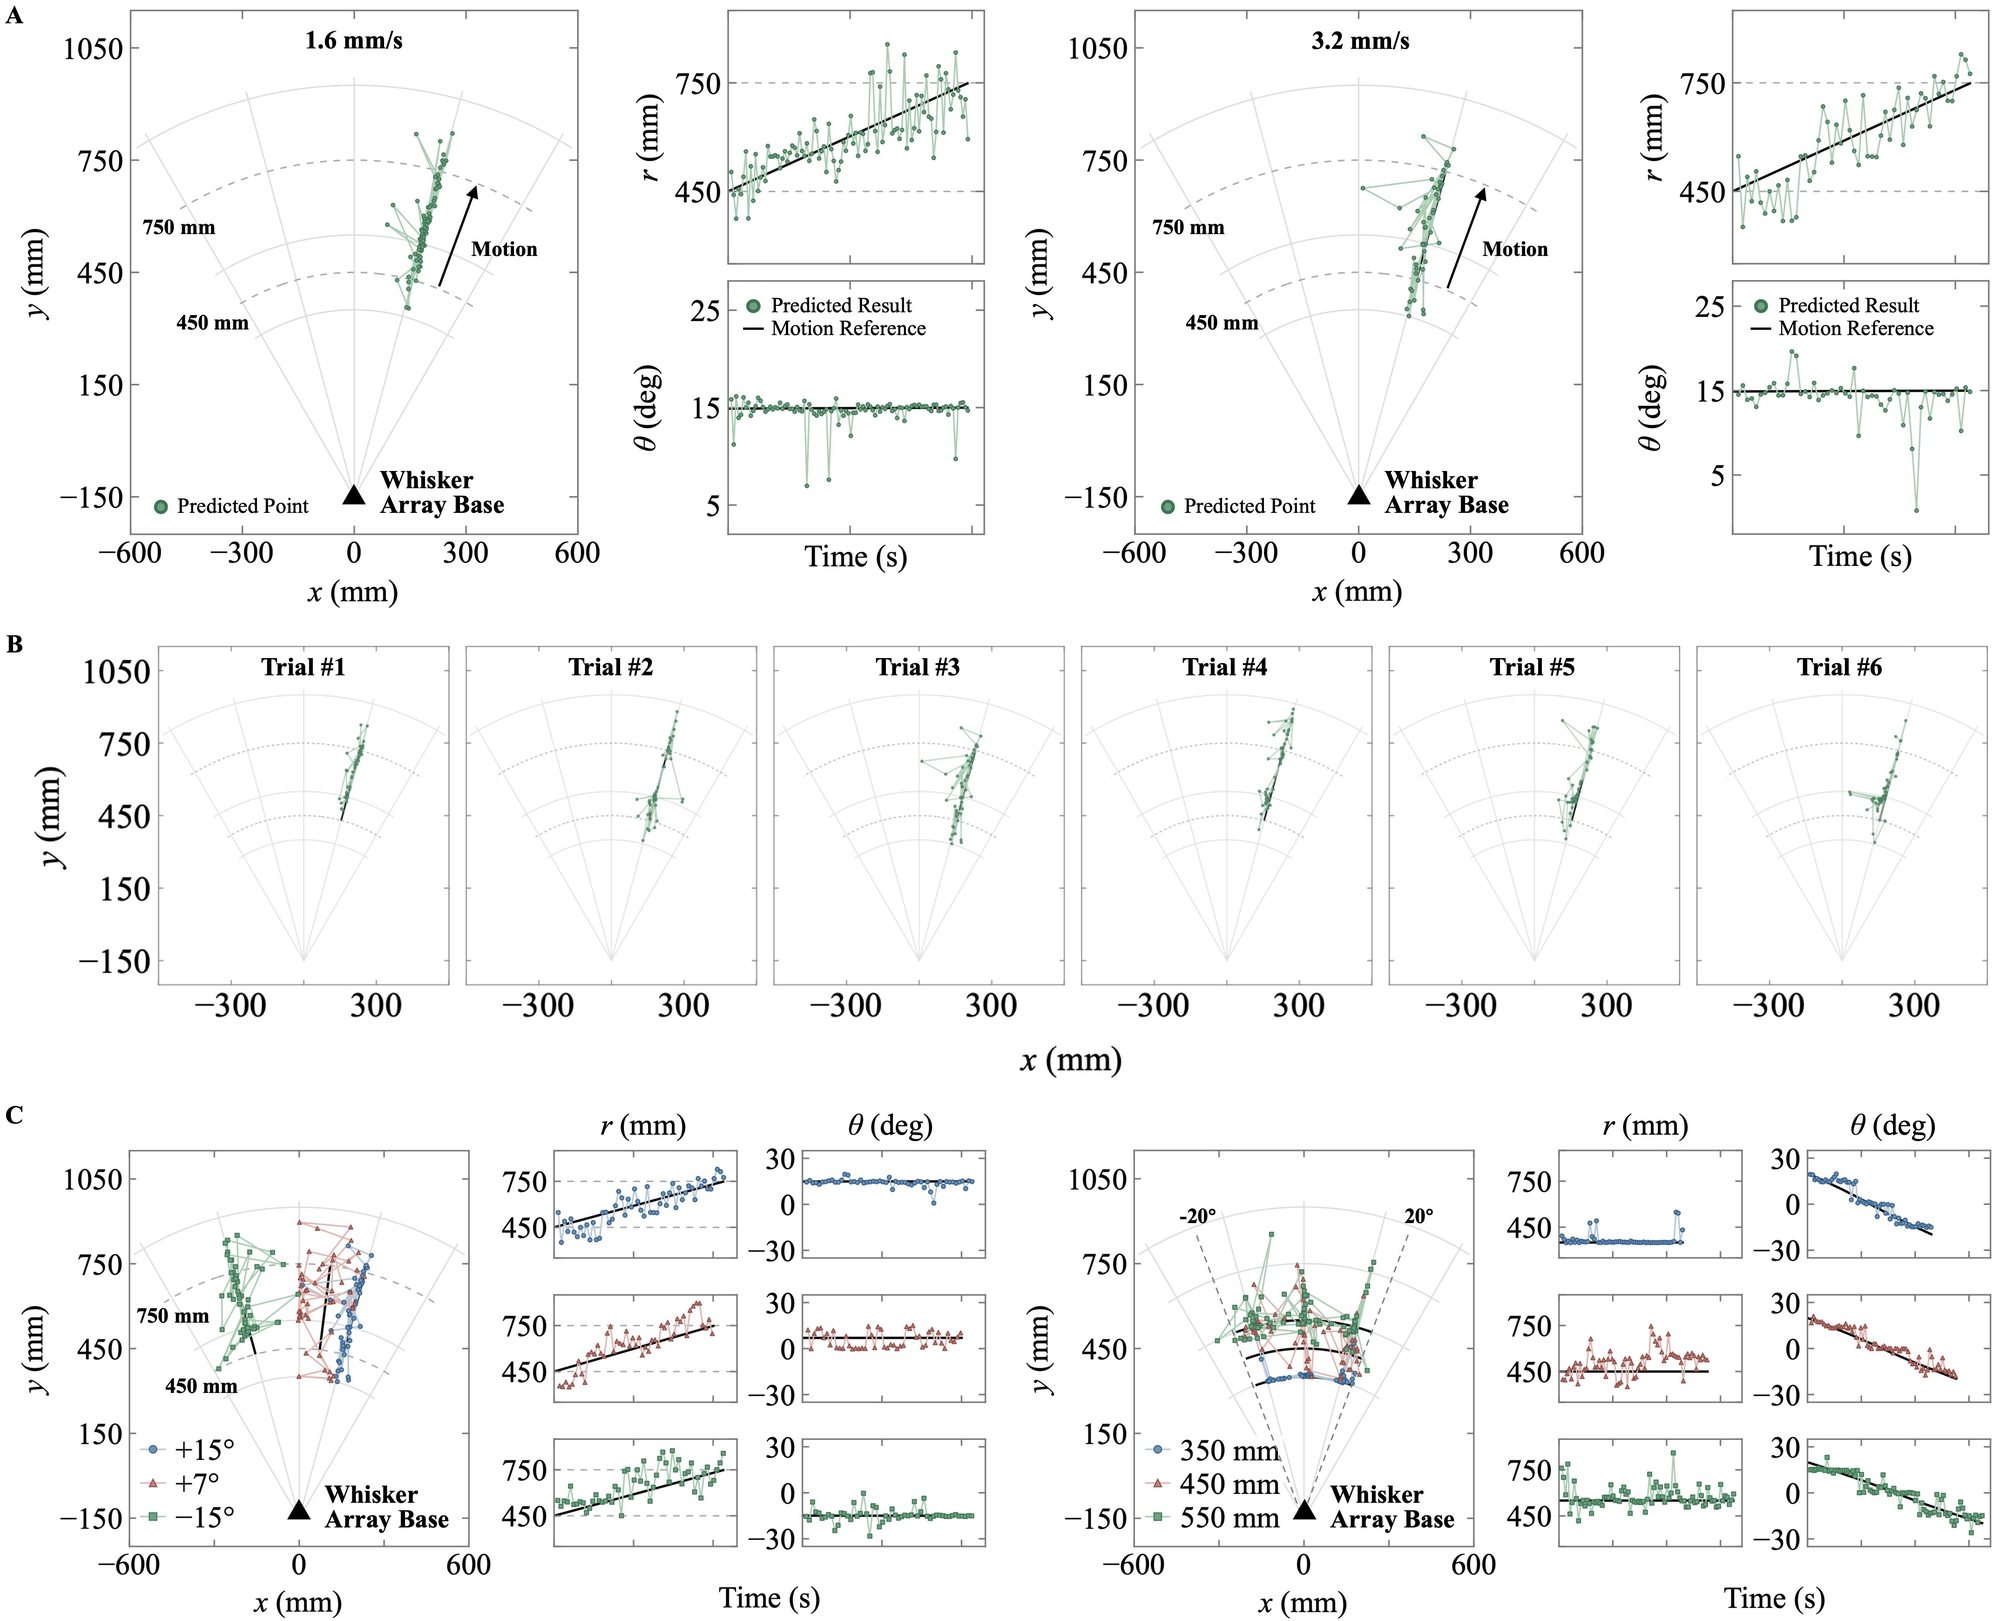
The model is trained only on stationary sources. The arc-motion
trials above test it at radii of 350, 450, and 550 mm, with the
largest errors on off-grid paths.
In a separate radial-motion experiment, the thruster moves from 450
to 750 mm at 1.6 mm/s. The estimate follows it with
51.7 mm range error and 0.63° angular error; six repeated runs
show the same trend. The full results below include both radial and
arc trajectories.
Explore the moving-source results
Speeds, repeatability, and trajectories
Two motion speeds (A), six repeated trials (B), and radial and
arc trajectories with the estimated r and θ over time (C).
Experimental scope
The localization experiments use a thruster in a pool, at the array's height, facing the array and operating at a fixed power. The results establish planar source localization under these conditions. Observing marine animals in the deep sea, and measuring how this sensing approach affects their behavior, remain future work.
How does source strength affect the response?
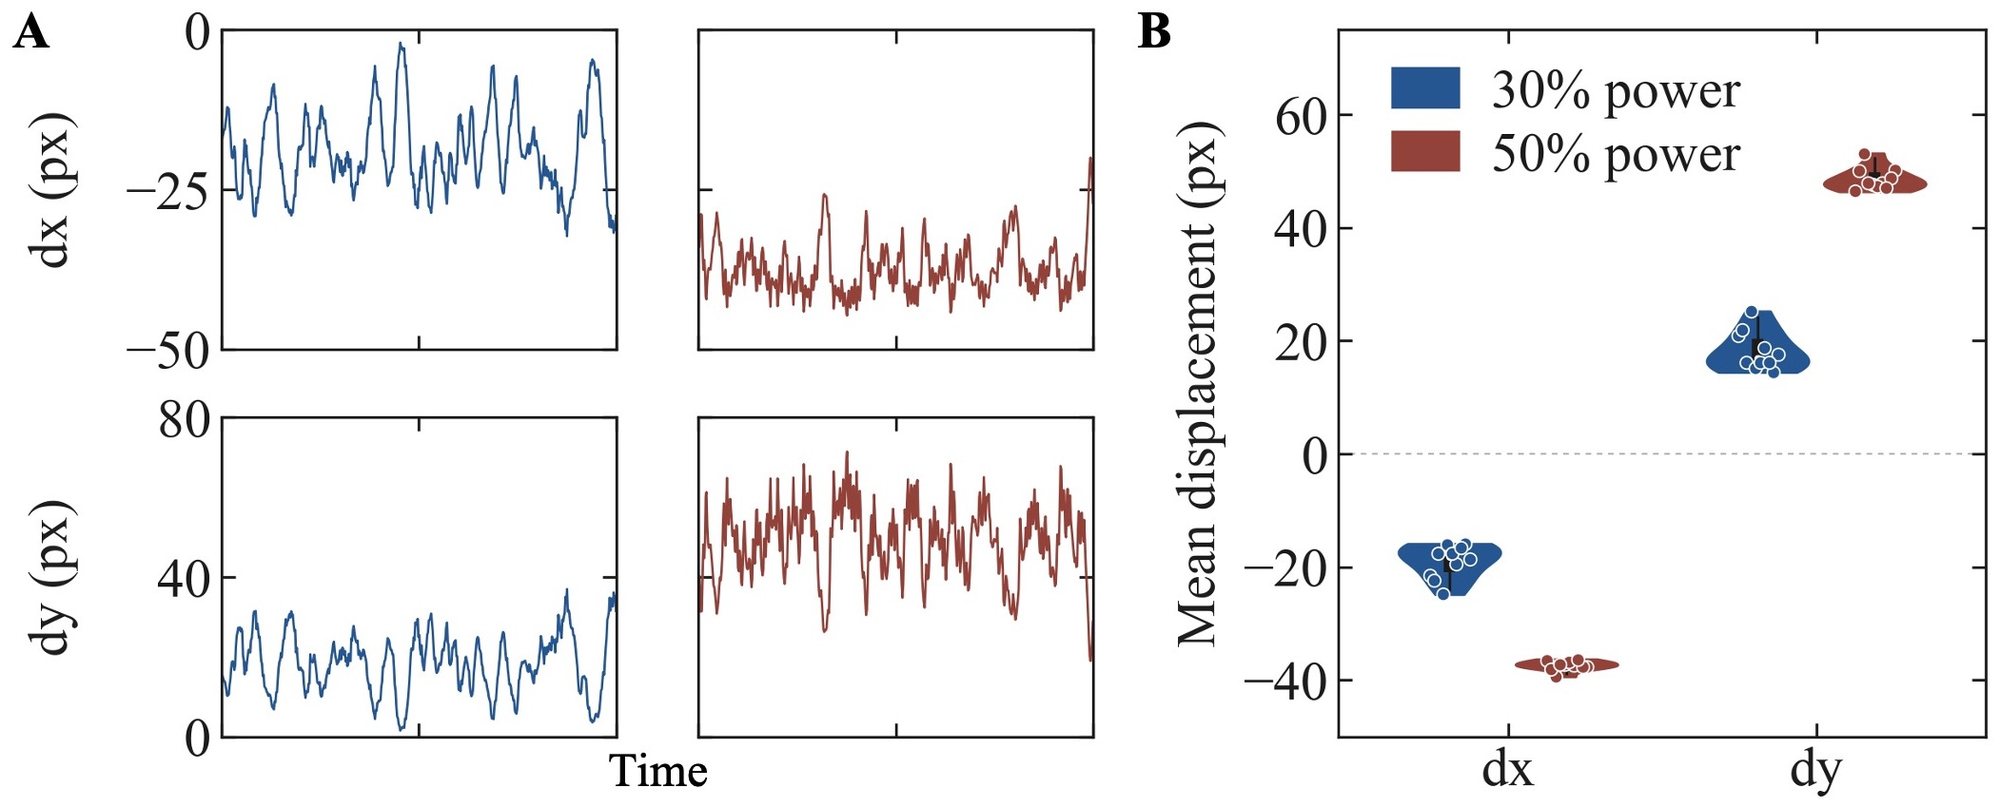
Whisker displacement at two power levels
Whisker response at two thruster power levels: displacement over
time (A) and mean displacement per 2 s segment (B).
@misc{xie2026fluorescenceenhancedwhiskerarrayvisionbased,
  title={Fluorescence-enhanced Whisker Array with Vision-based Deformation Analysis for Underwater Source Localization},
  author={Xiaochi Xie and Hao Li and Shixuan Zhao and Siyue Yao and Shuran Song and Mark R. Cutkosky},
  year={2026},
  eprint={2610.07275},
  archivePrefix={arXiv},
  primaryClass={cs.RO},
  url={https://arxiv.org/abs/2610.07275},
}
Abstract
Deep-water biological observation is essential for understanding
marine organisms and their interactions with the environment.
However, conventional optical and acoustic approaches can
introduce stimuli that alter animal behavior and bias biological
observations. This paper proposes a fluorescence-enhanced whisker
array sensing system that pinpoints underwater hydrodynamic
sources through local optical readout rather than direct source
imaging. Five spatially oriented whiskers, fabricated with nitinol
cores and fluorescent urethane shells, are integrated with
ultraviolet excitation and a monocular camera. Image enhancement
and segmentation are applied to track the whisker deformation.
Further, a lightweight convolutional neural network captures
temporal and cross-whisker features from 2 s sequences to
estimate source localization. Pool experiments achieve a mean
spatial localization error of 88 mm, with 73.5 mm in
radius and 2.5° in angle, across a test region of 600 mm with
±30°. Real-time localization of a moving thruster further
demonstrates the capability of the proposed method in dynamic
scenarios, highlighting its potential for integration into
underwater robots for hydrodynamic source detection, localization,
and tracking in low-light environments.
Questions about the paper or the whiskers:
Xiaochi Xie.
Full technical video
The complete walkthrough, from sensing hardware to localization
experiments.